Key takeaways
MER (marketing efficiency ratio) divides your store's real sales by your total ad spend, while Meta ROAS only counts the sales Meta attributes to itself. Read MER every day and by country, against a minimum MER and a maximum CPA for each market. A daily dashboard lets you turn off creatives that are over target before they eat the month's budget.
- Meta ROAS measures the sales Meta claims; MER measures real store sales against all ad spend.
- Break-even MER = 100 ÷ what you keep from €100 of sales before advertising.
- Set targets by country: a minimum MER and a maximum CPA for each market.
- Creatives over CPA only show up when you check them one by one against their country's target.
- A daily dashboard lets you fix things today, not at the end of the month.
MER vs ROAS comes down to one question: whose sales are you counting? MER (marketing efficiency ratio) is your store’s real sales divided by all your ad spend over the same period: MER = store sales ÷ total ad spend. Meta ROAS, on the other hand, only counts the sales Meta attributes to itself.
Meta ROAS is the most reassuring number in your e-commerce business. That is exactly the problem. It tells you how much Meta thinks it sold for you, not how much you actually sold. Those are two different figures, and you pay for the gap every day, in budget.
The number that answers the right question is MER. No attribution models, no conversion windows. What came into the till, divided by what went out on advertising.
Below we cover three things: why you should read MER every day, why you should split it by country, and how a daily dashboard lets you turn off creatives that are over CPA before they eat the month.
MER vs ROAS: whose results is each number measuring?
Platform ROAS is calculated by the company selling you the ads. With the standard attribution setting, Meta counts a sale as its own in two cases: the person clicked the ad in the previous 7 days, or only saw it in the previous 24 hours.
Now ask Google the same question. Google claims its share too. Then comes the newsletter, then people searching for your brand name. Each one takes credit for the same sale. Add up the ROAS of every channel and you get a store that, on paper, sells more than it takes in.
This isn’t a mistake on Meta’s part. It is how Meta measures. And the rules change without asking you: since January 12, 2026, Meta’s API no longer returns the 7-day and 28-day view windows. Anyone who used them saw fewer conversions in their reports overnight, without selling a single euro less.
Your bank account, meanwhile, knows nothing about attribution windows.
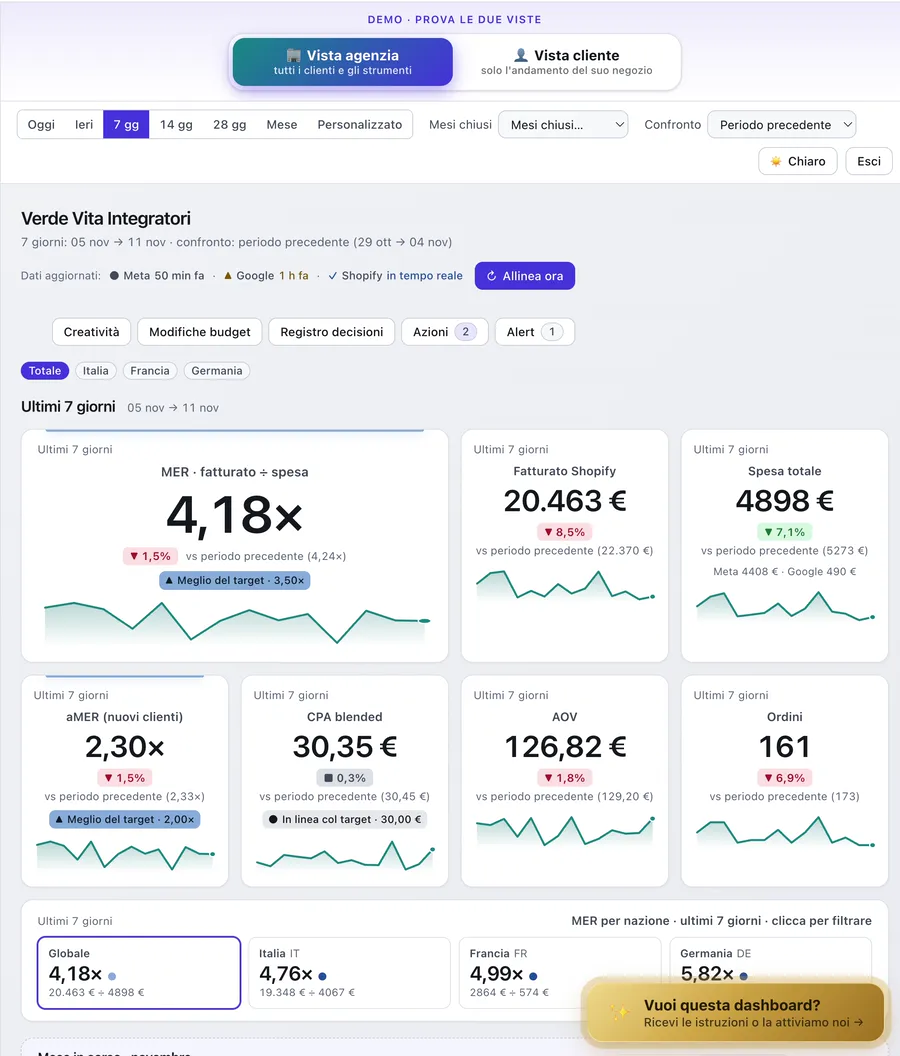
In our demo, with sample data, today’s screen shows it at a glance: at that hour Meta’s typical ROAS is 4.16×, while the store’s MER is 2.85×, below the 3.00× target. Meta feels above target. The store does not.
Here is how the demo scrolls, from the store overview down to the Meta campaigns:
What is MER (marketing efficiency ratio) and how do you calculate it?
The formula fits on one line:
MER = store sales ÷ total ad spend (Meta + Google + everything else), over the same period.
Shopify calls it a “blended” metric, which is why you will also hear it called blended ROAS: it measures all your advertising together and does not tell you which campaign worked. That is still ROAS’s job. MER tells you something more important: whether your advertising, as a whole, is paying for itself.
A real case from one of our clients. September 2024: €54,000 in total sales with €41,000 of Meta spend, an MER of 1.32. In October the budget moved from traffic campaigns to conversion campaigns: €65,000 in sales with €23,000 of spend, MER 2.83. Less spend, more sales. MER says it in one line, and the same yardstick works when you promote an Instagram Live and judge it on MER.
Results of individual clients, not guaranteed. Shopify total sales include shipping and taxes.
Break-even MER. Take €100 of sales. Subtract product cost, shipping, payment fees and returns. If you are left with €40, those €40 have to cover advertising and your profit. Your break-even MER is 100 ÷ 40 = 2.5. Below 2.5, advertising costs you more than it brings in. Above it, you start making money.
One rule: decide how you count sales and never change it. In our dashboard we use total sales as Shopify shows them, including VAT and shipping. MER exists to compare one day with another. Change the definition and the comparison breaks.
Why read MER every day, country by country?
Monthly MER is an autopsy: you read it at the end of the month, when the budget is already gone. Today’s MER is a diagnosis: you read it at 11 am and by 3 pm you have already corrected course.
One caveat: at 11 am you have always sold less than you will by the end of the day. So today’s MER should not be compared with last night’s, but with the typical value at the same hour. That is what the dashboard does: “2.85× vs typical at 06:40”.
And if you sell in several countries, a single MER lies to you on average. Average order value, shipping cost and return rate change from country to country. Two €60 orders, one in Italy and one in Germany, do not leave you the same margin.
That is why targets are set by country: a minimum MER and a maximum CPA for every market you spend in. The maximum CPA comes from the same calculation as before. If an average order in Germany leaves you €30 before advertising, every purchase that costs more than €30 is a losing order. How much to invest overall is a different question, and that is what our forecasting engine is for.
Creatives over CPA: where budget leaks without a sound
Budget doesn’t burn in a day. It melts.
A creative that brought in orders at €25 last month brings them in at €48 today. No alarm, no notification. Meta keeps spending on it, because as far as Meta is concerned that creative is still “working”.
Campaign CPA often misses it: the good creatives prop up the average and hide the ones that are losing. You only see it by looking at one creative at a time, against the target for its country.
The rules we use:
- each creative is compared with the target CPA of the country it spends in, not with the account average;
- a minimum spend is required before judging, so you don’t kill an ad after two hours;
- creatives over CPA rise to the top of the list, with a Turn off button next to them;
- the dashboard also writes the reason, for example “expensive carts and purchases over CPA”;
- before turning anything off, check the day’s MER: if the store is selling anyway, that creative may be working higher up the funnel.
When a creative goes off, you need a new one ready: we explain how in Meta Ads creative fatigue.
What should a daily MER dashboard show?
You don’t need a control panel with fifty charts. You need four screens, each answering one question.
1. Today: how much did I sell and how much did I spend? Today’s real MER, from Shopify orders and Meta and Google spend, against the target and against the typical value at the same hour.
2. Creatives: which ones are burning budget? The ones over CPA, at the top, with the button to turn them off (the screen you saw above).
3. Budget: how much am I spending, and when? Budget changes and hourly scheduling: you raise spend in the hours when the store sells and lower it at night, without waking up at 2 am.
4. Overview: which store do I check first? If you manage several stores, or you are an agency, in the morning you want to know right away who is above target and who isn’t.
We put a demo online with fake data: click anywhere, you can’t break anything. To see a sample store over the last 7 days, try the live demo.
Want us to build it for you?
There are two ways to go. Everything is also on our free performance dashboard page.
The first is free. The PDF guide has the full specs: which data to pull from Shopify, Meta and Google, how to calculate MER and CPA by country, how to set up turning off creatives and scheduling the budget. Hand it to an AI and build it yourself.
The second is for people who don’t want to lose their weekends: we build it for you, on your accounts, and it stays yours. It is a paid service, quoted on request.
Choose your option in the form at the end of the article.
Don’t throw ROAS away. Put it in its place
ROAS helps you choose between one campaign and another. But the question that matters in the morning is a different one: did advertising pay for itself yesterday?
Only MER answers that. Read it every day, split it by country, turn off whatever is over target. For an example of what happens when you cut the right budget, read how we reduced ad spend and increased sales.
If you want to go through your numbers with us, book a free consultation.
If you want the dashboard instead, choose below: the free PDF instructions, or we build it for you.
Done. The guide is here: Open the PDF (in Italian). We will also email it to you.
Got it. In a few minutes you will get an email with the steps and how to ask us for a quote.
FAQ
What is MER in marketing?
MER, or marketing efficiency ratio, is your store's total sales divided by your total ad spend over the same period. It ignores attribution and tells you whether your advertising, as a whole, is paying for itself.
What is the difference between MER and ROAS?
ROAS measures the sales a platform attributes to its own ads; MER measures all sales against all ad spend. Use ROAS to choose between campaigns and MER to decide your budget.
Is MER the same as blended ROAS?
In practice, yes. Shopify describes MER as a blended metric: it measures all your advertising together, so it does not tell you which campaign worked, only whether the total spend is paying off.
What is a good MER for an e-commerce store?
It depends on your margin. Work out what you keep from €100 of sales before advertising: if you keep €40, your break-even MER is 2.5, and above that your ads are making you money.
Why doesn't Meta ROAS match my Shopify sales?
Three reasons: attribution windows (7-day click, 1-day view), the same sale being claimed by several channels, and sales that actually come from organic and email.
Sources
Want to apply this to your e-commerce?
A free consultation to see what would work in your store.
Book a free consultation